Web Log File Analyzer Pro
Now Apache log file compatible
Usually, the different software used to extract data from log files consider as a “hit” each of the requests for the elements needed to display a web page (each frame, each image, animated GIF, etc.). Since a single web page can be built from numerous disparate elements, tens of “hits” can result from a single click by a visitor. Moreover, requests for missing pages and hundreds of requests by worms are also reported as “hits”. These software will report flattering statistics about the “popularity” of your web site that often have little meaning other than your server’s work load .
To avoid seeing significant requests be drowned among futile data, you need a specialized tool. Our Web Log File Analyzer Pro gives you a clearer view of your visitors’s preferences among what’s available on your web site. It gives you a competitive advantage by allowing you to adapt your web site to the interests and expectations of the people visiting it and hopefully, to help you to respond to the needs of the market place.
This software is a 32-bit Windows application, compatible with all 32-bit versions of Windows (Win98, WinNT, Win2000 and WinXP). It was not tested under Windows Vista: like thousands of software, it’s probably not compatible with it. Moreover, it is not a web application in the sense that it has to work locally: you must download your log files and analyze them on your computer. It is composed of two executables: “Start_Me.exe” and “Statistics.exe”. The former is the main one. From it, you can select the log files to be analyzed and proceed to the analysis. Once this is done, you can consult the results from that first module or by running “Statistics.exe” directly.
Log Files Supported
Web Log File Analyzer Pro is compatible with four types of log file formats; the Apache “Combined” log file format, the ones created by Microsoft Internet Information Services (MIIS) version 5, those created by MIIS version 4 and finally those created by an unknown software (at least unknown to me) that creates log files whose name has the following skeleton: “inYYMMDD.log”. The latter are formatted like this:
123.456.78.90, -, 4/28/01, 0:55:11, W3SVC, ISIS, 209.237.188.250, 31, 345, 72, 304, 0, GET, /bulletin.htm, Mozilla/4.7 [fr] (Win98; I), -, -, |
|
The names of the Apache Combined log file format have the following skeleton: “access_log_MonthDay_Year” (with or without a “.txt” extension). These log files are formatted like this:
static-123-456-78-90.xxxxxx.telecom.net - - [02/Jan/2008:13:21:08 -0500] "GET /divers/Le_gout.htm HTTP/1.1" 200 9467 "http://www.google.ca/search?hl=fr&q=foyer+friedland+paris&btnG=Rechercher&meta=" "Mozilla/5.0 (Macintosh; U; Intel Mac OS X; fr-fr) AppleWebKit/419.2.1 (KHTML, like Gecko) Safari/419.3" |
|
The software can also analyze the log files created by Microsoft Internet Information Server (MIIS) versions 4 and 5. Please note that in the Properties of the Login page of MIIS Manager, all the possible entries must be selected in order to get log files that are compatible with Web Log File Analyzer Pro. These log files have a name similar to “exYYMMDD.log”.
The header of the log files created by MIIS version 4 looks like this:
#Software: Microsoft Internet Information Server 4.0 #Version: 1.0 #Date: 2001-10-14 00:03:23 #Fields: date time c-ip cs-username s-sitename s-computername s-ip cs-method cs-uri-stem cs-uri-query sc-status sc-win32-status sc-bytes cs-bytes time-taken s-port cs-version cs(User-Agent) cs(Cookie) cs(Referer) 2001-10-13 11:02:49 123.456.78.90 - W3SVC15 CJ330606-B 216.177.38.30 GET /bulletin.htm - 200 0 3851 131 312 80 HTTP/1.0 Mozilla/4.0+(compatible;+MSIE+5.0;+AOL+5.0;+Windows+98;+DigExt) - - |
|
Those created by MIIS version 5 have the following header:
#Software: Microsoft Internet Information Services 5.0 #Version: 1.0 #Date: 2005-03-28 17:42:33 #Fields: date time c-ip cs-username s-sitename s-computername s-ip s-port cs-method cs-uri-stem cs-uri-query sc-status sc-win32-status sc-bytes cs-bytes time-taken cs-version cs-host cs(User-Agent) cs(Cookie) cs(Referer) 2005-03-28 17:42:33 123.456.78.90 - W3SVC1 WALLY2 192.168.1.3 80 GET /warrenrogersassociates/index.html - 304 0 206 546 0 HTTP/1.1 wally2 Mozilla/5.0+(Windows;+U;+Windows+NT+5.1;+en-US;+rv:1.7.5)+Gecko/20041217 - - |
|
List of Features
Two versions available
Web Log File Analyzer Pro comes in two versions: the demo version and the registered version (the latter costs: $300US). The demo version is identical to the registered version except that it’s good for a month.
The Data Processor Module
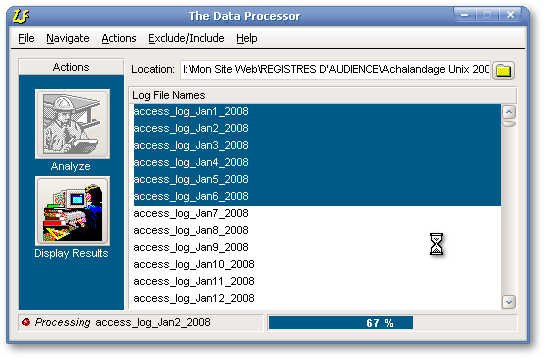
To analyze the data recorded in log files, the user has to click the pushbutton near the upper right corner of the Data Processor in order to select the folder where some log files are located. Then the user must select one or more files and push the Analyze pushbutton at left.

A backup of your database is created automatically every 50 log files.
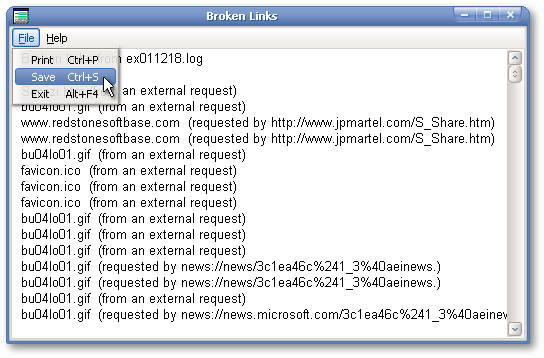
Once the analysis in completed, if some “404 missing page” error messages are documented in the log files, a report about the broken links will be displayed (that report can be printed). When the missing page is requested externally (for example, when it was requested through the visitor’s browser), the name of the missing page will usually be followed by the comment “(from an external request)”. As can be seen below, sometimes the external requests will be identified, but they are the exception, not the rule. On the contrary, when the broken link is caused by some error in the HTML code of a page located on the server, the name of the erroneous page is given. So broken links can be avoided in the future, thanks to this feature.
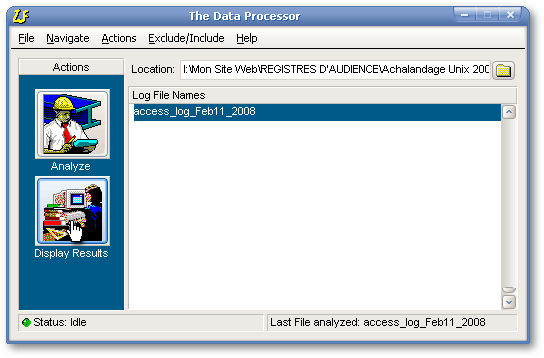
The result of the analysis can be accessed by clicking the “Display Results” pushbutton near the bottom left corner on the Data Processor or can be accessed directly through a second executable called “Statistics.exe”.
The Analysis Results Module
The Daily View Tab
The first tab of the Analysis Results module (shown below) is the Daily View. It’s a summary of the data extracted in each daily log file that was processed in a folder. After the analysis, even if some log files are deleted or moved, they will still appear under the Daily View tab as if they were still there. It is recommended to limit the number of log files processed in a specific folder otherwise this module will become slow. Personally, I keep log files from each year in different folders. Other than the hits number and the number of visitors, all the other data is global (i.e.– related to all the log files that were processed by the software). If your server harbours different web sites, you are authorized to install as many copies as you want of the Web Log File Analyzer Pro and process each web site separately. As for all the other ones, the data displayed in the grid can be printed, can be saved as a printer file, or can be exported as an HTML document. As for the output quality, the HTML reports are very simple and the printed reports are very crude.
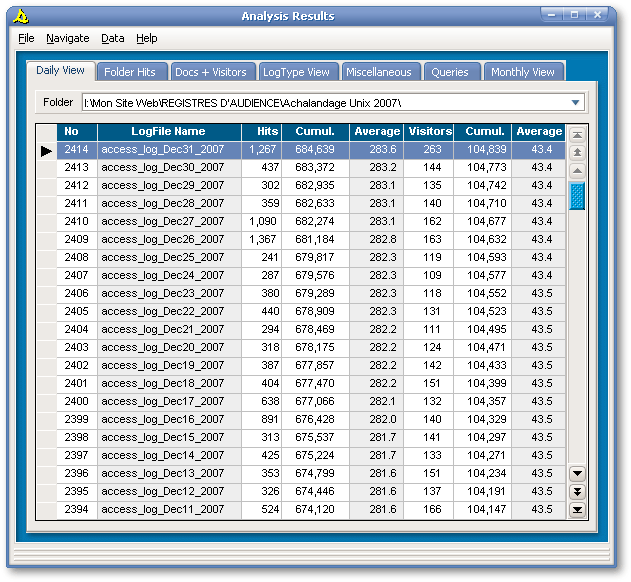
In the example above, after 2 414 days, 684 639 hits were recorded on my Web site. Moreover, a daily average of 283.6 hits and a daily average of 43.4 people were registered. The software can be configured to process Internet documents having an extension among the 10 files extensions supported. In the example above, only data for HTM, ZIP and PDF documents were processed. As stated previously, you can configure the software to take into account only the data that’s important for you. The daily number of visitors is the total number people who visited the web site that day, whatever it was their first visit or not. On the other hand, the cumulative number and the average are for unique and different people (actually unique IP address or URL). Since dynamic IP Addresses are seen as different visitors, the cumulative numbers and the averages might be an overestimation.
The Folder Hits Tab
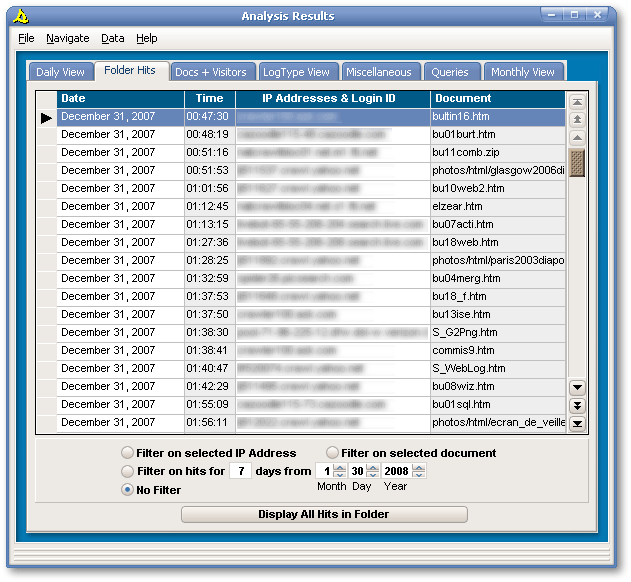
The second tab of the Analysis Results module allows you to see the list of individual hits. By default, these hits are the ones recorded in the log file selected under the Daily View tab. However, if the “Display All Hits in Folder” pushbutton (at the bottom) is clicked, the hits recorded in all the log files in the current folder will be displayed. The software can also filter on the selected IP Address, on the selected document, or can display all the hits recorded during a certain period of time. If only the hits from a single log file are displayed, filtering on the highlighted document will show only the hits related to that document for that day. On the other hand, if all the hits in the current folder are displayed, that filter will show all the requests for the highlighted document in all the log files processed in that folder.
The Docs + Visitors Tab
Under the third tab of the Analysis Results module, all requested documents and all the visitors are listed. This is a global view in the sense that these documents and these visitors are those recorded from all the log files processed by this instance of the software. In other words, it is not restricted to the log files in a specific folder, contrary to the first two tabs of the Analysis Results module.
By default, documents are listed from the most popular ones to the least consulted ones: likewise, visitors are listed from those who visit your site most frequently to those who come rarely. However the headers of these two grids are set in a different color (mauve rather than dark blue). This is a visual indication that these are Power Headers. Ordinary headers can only be moved (their order can be rearranged within the grid): when clicked, Power Headers have the power to rearrange data in the column below them. For example, if the Documents or the Extension Power Header is clicked, the data will be displayed in alphabetic order based on the document file names or on their extensions. If the Count or the Requests Power Header is clicked, the data will be displayed by decreasing hit count order or decreasing request order. This is done instantaneously whatever the size of your database.
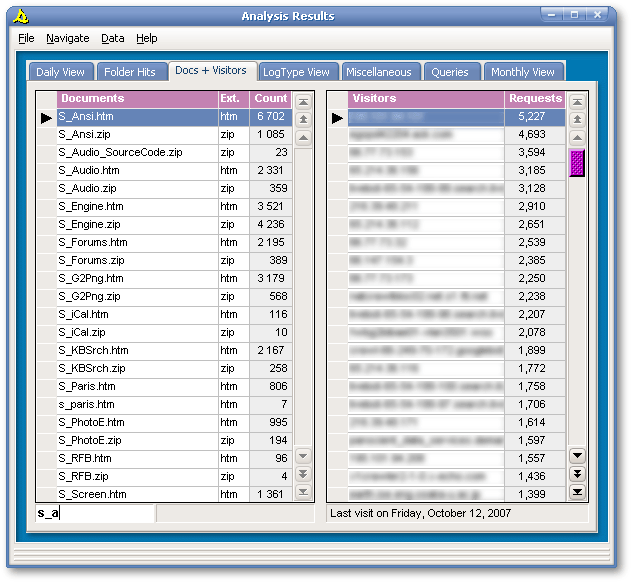
Below each of these two grid are their respective Status Bar. At right, the Status Bar of the Visitors grid shows the date of the last visit of the highlighted visitor (here, October 12th, 2007). The gray half of the Documents Status Bar shows the highlighted document’s path. In the example above, it shows nothing because the current document is located in the root folder. When the documents are listed in alphabetic order, a “Seeker” (with its characteristic white background) appears in the left side of the Status Bar, while the grid’s vertical scrollbar gets disabled. What’s a seeker? That’s a fast and handy mean to search for a specific file name; as soon as the user types a few characters, the row cursor jumps at the first document whose file name starts with these characters (as the example above). That search is instantaneous.
The Log Type View Tab
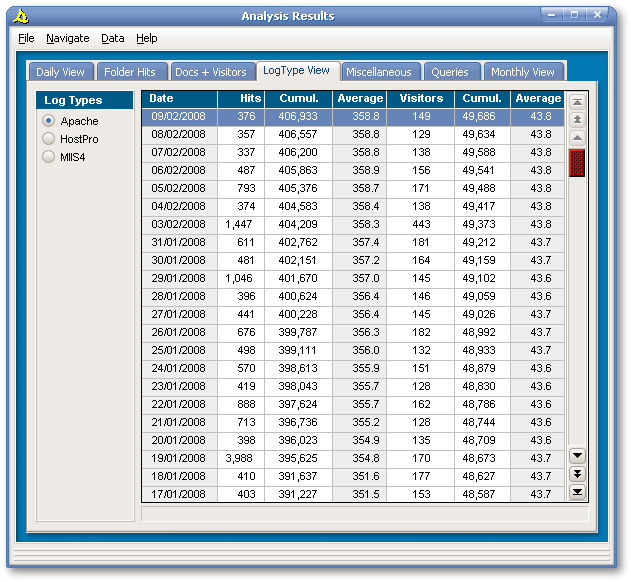
If your Web site was harboured by many Internet Service Providers over the years and if you ended up with log files written in different log file formats, this tab will display your data according to these formats. At left, the number of radiobuttons is not fixed but dynamic. The software uses a patent technology to create the number of objects needed. For example, if your log files are written in three different log file formats, the Analyzer will create three radiobuttons. None will be created if the log files are all written in the same log file format.
The Miscellaneous Tab
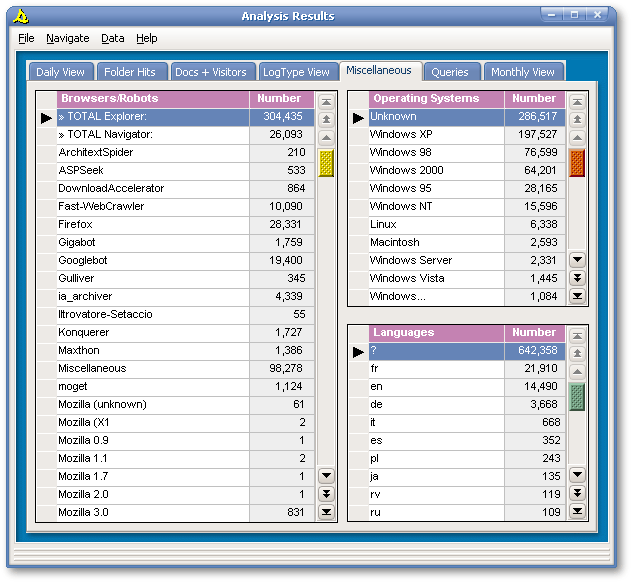
The fifth tab of the software gives some details about the characteristics of the people visiting the web sites analyzed. These are global statistics In other words, they are not specific for one log file, nor for one folder: they are the cumulative statistics for all log files processed so far. Each grid displays different data: the browser used, the operating system and a hint about the language of the visitor (de=German, en=English, es=Spanish, fr=French, etc.). Here again, each grid is headed by Power Headers.
The Queries Tab
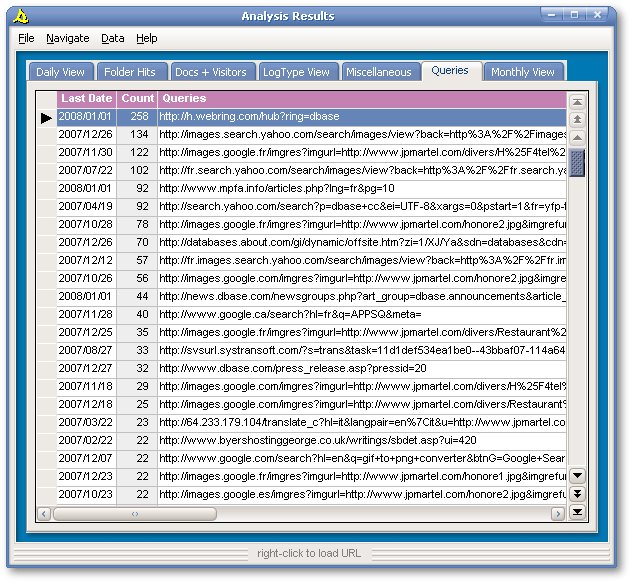
The Queries tab helps to know how some people ended up visiting your site and whose Search Engine (Google, Yahoo, MSN, etc.) contributes the most to your site's popularity. Moreover, when a query is right-clicked, your browser is loaded and that query is requested live on the Internet, allowing you to see how your Web site is ranked when some key words are used to make a request under that Search Engine.
This grid is headed by Power Headers and displays the data related to the log files in the current folder. If you follow my advice to keep the log files for each year in different folders, how come queries can be seen from both 2007 and 2008? Simply because the log file dated December 31st contained a few hits recorded after midnight, January 1st, 2008.
The Monthly View Tab
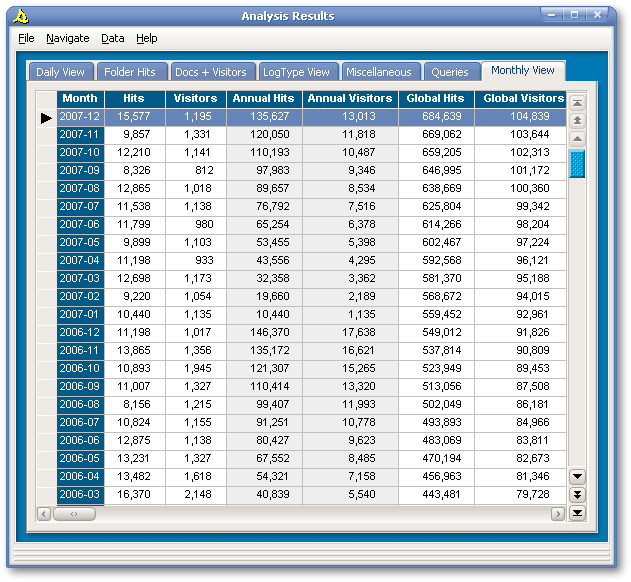
The last tab is one of my favourites. It’s a summary of all the data processed by the software. In other words, it’s a global view. Let’s give a look to the first line of the grid, related to the month of December 2007. In that month, there were 15 577 requested for html pages, ZIP or PDF files (because we have limited the analysis to these files only). In that month, there were 1 195 unique visitors. For the whole year, we had 135 627 hits and 13 013 visitors. Since we have log files at our disposal (since April 23rd, 2001), my Web site had to provide 684 639 web pages requested by 104 839 visitors. When the window is maximized or when its horizontal scrollbar is used, average daily hits and visitors, average monthly hits and visitors can be seen. For me, the Monthly View is the best way to see the evolution of a web site.
The Data Management Module
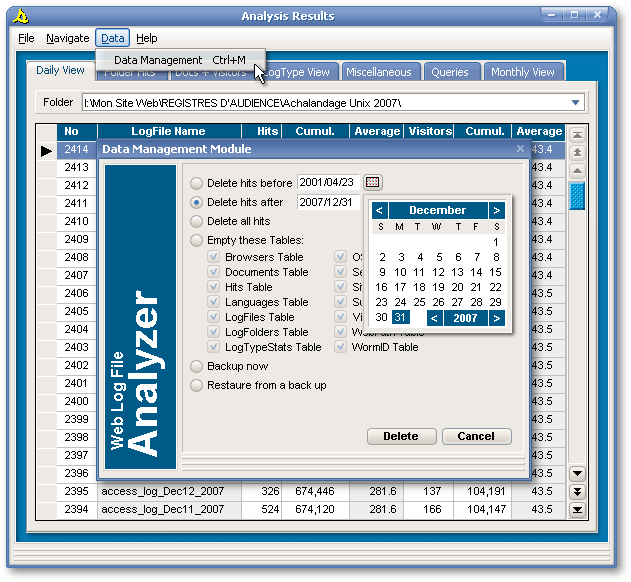
The Data Management module allows the user to delete hits selectively or to empty one or many tables. Of course, when a table is empty, no data can be seen in the grid to which that table is connected.
The user can also make a backup of the database with the option Backup now. I, for one, like to take a snapshot of my database at the end of each year. Contrary to the automatic backups made every 50 log files, these custom backups are not deleted automatically.
Lastly, the Data Management module allows the user to restaure the database from an automatic backup. When a power failure happens precisely when data is written to disk, there is a serious risk of data corruption. This feature is a solution to data corruption. However, it isn’t a preventive measure against hard disk crash. Consequently, periodic ordinary backups are thus still needed.
The IP Address Exclusion Module
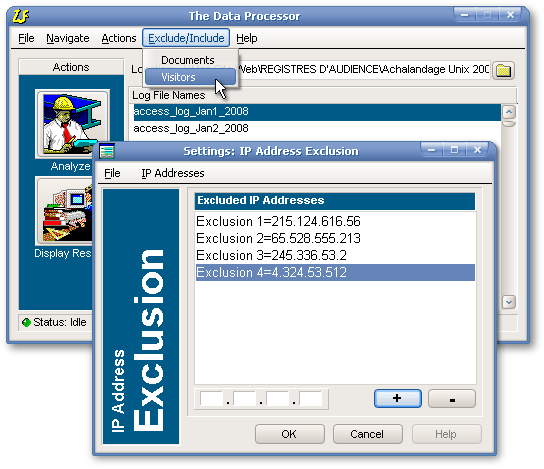
The user can also exclude IP Addresses from the analysis. Many years ago, I’ve included a module (illustrated below) whose goal was to avoid counting hits from the user’s office (such as for testing) or from in-house LAN. These days, in only a minority of the hits, the IP Address is noted (at least in my Apache log files). So this module has little practical usefulness.
The Configuration Module
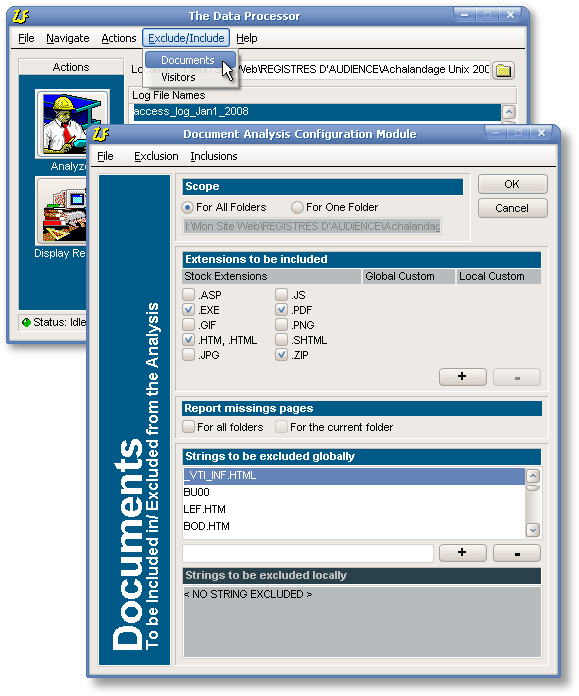
The user can set which file extensions will be processed: unselected file extensions can thus be excluded from the analysis. Missing pages can be recorded as hits or can be excluded from the analysis. In all cases, the Missing Page Report will still be displayed as soon as the analysis is completed. The software will not take into account documents whose names contain a string of characters listed in the exclusion list. Lastly, custom extensions can be set: five extensions can be set globally and five other custom extensions can be set for each folder. That means that Web Log File Analyzer Pro can be used to monitor the access of any kind of document in an Intranet.
Conclusion
With its Power Headers, its Seeker, its “live” URLs (among other things), this analyzer allows its users to interact with their data better than with any kind of static report. Moreover, it is possible to configure the software to exact from log files, precisely the data which is significant for the user.
Installation
If you are installing Web Log File Analyzer Pro for the first time:
The tables and the indexes of the Web Log File Analyzer have been changed substantially with version 4.0. All the tables created with older versions are incompatible with version 4.x. An upgrade path is provided for registered users only. If you’re not a registered user and are already using an older version, download the newest version and begin your analysis from scratch.
History
Cost
The Web Log File Analyzer Pro demo is good for one month. The full, unlimited copy of the software cost 300 $US.
Users can install as many instances of this software as you want on a maximum of two of their computers. The software can be paid by three different means: with PayPal (click on “PayPal” to proceed), with a postal money order or with a check drawn on a US or Canadian Bank. I’m not found on Money Transfers. If you pay with PayPal, please send the money to jpmartel@aei.ca and add a small note saying what software you’re paying for and give the email address to be used to receive the full version of the software. If you send a check or a money order, please include the form below and mail everything to:
Jean-Pierre Martel
2295 av. Jeanne-d'Arc, app. 5
Montréal QC H1W 3V8
CANADA